

State of the Economy: Edmonton unfiltered
The good, the bad, and the 'hey, at least we're affordable'.
Why a State of the Economy Report for Edmonton?
We asked the tough questions and crunched the numbers—not because we love gloomy charts, but because knowing where we stand is the first step to getting stronger. This report gives Edmonton’s business community the unvarnished picture: the wins, the struggles, and where we’ve got room to grow. It’s not always pretty, but it’s always useful. This site is a look into some of the most prominent findings. Read the full report to find out more and access exclusive spend-per-capita numbers for the region.

The Good
Edmonton’s economy is rooted in a solid foundation. We’ve got rising regional exports, a healthy housing market, and regionally high median household incomes. It’s not perfect, but we’re definitely in better shape than some.

The Bad
Job growth has slowed. Labour force participation has dropped, and Edmonton’s industrial tax competition is heating up from other cities. On top of that, Edmonton’s median household income within the city has been stagnating. We’ve got work to do, but we're not backing down.
The Gist
A youthful, diverse workforce? Check. Now if only we could put more of them to work. Edmonton is still one of the most affordable big cities in the Canada... even if debt is climbing.

Strong Foundation, Slow Jog
We’ve got the building blocks of a powerhouse economy — just running the race in slow motion right now.
in regional exports
2nd among mid-sized Canadian metros
New businesses added in 5 years
Below the 8-10% peer
Over the past 5 years
Peer metros averaged 8.2%

Export Champs
$115 billion in regional exports last year. Half of it from Edmonton. Someone’s clearly pulling their weight.
Exports (Billions of CAD)
Edmonton exported $115 billion in goods and services last year — second only to Calgary and ahead of Ottawa, Winnipeg, and Halifax.
Share of regional exports
Half of all regional exports come directly from Edmonton — underscoring the city’s central role in driving the metro economy.

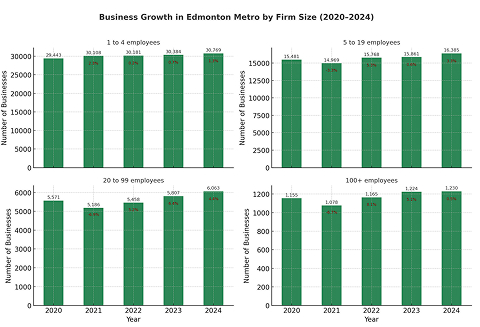
Business count up, up, up
More than 54,000 businesses across the region and climbing. (Turns out entrepreneurs like it here, too.)
Number of businesses
With more than 54,000 businesses, Edmonton rivals Calgary for one of the largest business communities among peer metros, showing that entrepreneurs and employers continue to find opportunity here

Jobs
We’re growing, our neighbours are sprinting. City industrial taxes? They’re basically a “this way, please” sign to the region.
5 Year % Change in number of jobs
Edmonton’s job base expanded 5.8% over five years — a solid foundation, but slower than the gains seen in most peer metros.
5 year increase in number of jobs
While the City of Edmonton accounts for 72% of jobs in the metro region, we only accounted for 13% of jobs gained over the past 5 years.
industrial property taxes
Industrial property taxes in the City of Edmonton are substantially higher than in surrounding municipalities, creating a competitive disadvantage for attracting and retaining industrial employers in the City.


Youthful Population, Untapped Workforce
Edmonton benefits from a young, growing population and a large labour pool — key ingredients for future growth — yet it has not fully converted these into superior workforce outcomes.
Prime working-age population
2nd highest among peer metros
Median age
Youngest among peer metros
Labour force participation over 5 years
Steepest drop among peer

Talent Base
Plenty of people, plenty of pros — now the job is activating that bench for higher participation and paycheques. In other words: the talent is here; let’s use it.
prime age talent pool (age 25-44) share of population
Nearly one-third of Edmontonians are in their prime working years, giving the region one of the largest talent pools among midsize Canadian metros.
educational Attainment by metro
Edmonton stands out for its strong base of trades talent — with the highest share of workers holding trade certificates among peer metros, fuelling many of our export sectors.

Plenty of People, Fewer Paycheques
Our population is young and growing, but too many are still on the sidelines instead of in the workforce.
5 Year % change in population
With the lowest median age among Canada’s midsize metros and 11% growth over the past five years, Edmonton is cementing its role as a young and expanding urban centre.
Labour force Participation rate, 2019 vs 2024
A smaller share of Edmontonians are active in the labour force - meaning they either have a job or are actively looking for one - compared to five years ago. While now in line with peer metros, we’re losing our advantage in the labour market.

Affordable...ish
Housing and living costs are lower than in Calgary or Ottawa — but ballooning debt is the not-so-cute sidekick.
Rate among residents
2nd highest among peer metros
Median household income
2nd highest among peer metros
Inflation-adjusted median income over 5 years
Only peer metro to see a decrease

A place to call home
Value you can feel, quality you can see, and momentum you can believe in — that’s why “home” here so often comes with a set of keys.
homeownership rate
Edmonton’s relatively lower housing prices, combined with strong quality of life, translate into one of the highest homeownership rates among Canada’s midsize metros.

High Wages, Real Declines
Median income is a sweet $99,200 — but adjusted for inflation, we’ve actually lost ground. Less “making it rain,” more “making it drizzle.”
Median household income, Thousands of 2023 dollars
Edmonton still ranks near the top for median household income, but inflation has eroded gains — leaving families with less real spending power than five years ago.

Debt heavy, wallet light
Nearly three-quarters of households carry debt, with the highest median debt of ~$199,300 among peers. Apparently, we’re #1 at owing.
median total debt: 2012-2023
Median household debt in Edmonton has risen 63% since 2012 — the sharpest climb among peer metros.
Mortgage Delinquency rates, 90+ Days
Edmonton’s mortgage delinquency rate is the highest among peer metros and the second-highest of any Canadian metro — signalling that financial stress may be elevated despite the region’s relative affordability.

Same region, different stories
The city drives culture and diversity. The suburbs are sprinting ahead in jobs and income. Both matter. Balance matters more.
Edmonton Region*
City of Edmonton
Edmonton Region*
City of Edmonton
Edmonton Region*
City of Edmonton
Resilient.
Resourceful.
Realistic.
Edmonton isn’t topping every chart (yet). But we’re building, adapting, and—let’s be honest—still one of the best places in Canada to live, work, and do business.
Get the full report.
Access the complete story and get exclusive spend-per-capita numbers delivered to your inbox.